The first assignment has been handed out. You can find it here.
Informally, a function represents how one quantity depends on another. Functions can be used as mathematical models of real-world data such as showing how much interest has accrued in a savings account depends on the amount time elapsed since the principal was deposited.
Functions can be expressed verbally (describing the relationship between the quantities in words), numerically (with the use of a table of values), algebraically (using a formula), and visually (with the use of a graph).
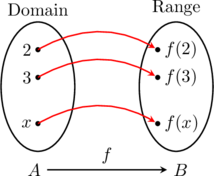
A function
is a mapping that assigns to each element in a set
(called the domain), one and only one element in a set
(called the range).

Let ![]() be a function, and if
be a function, and if ![]() is a number in the domain of
is a number in the domain of ![]() , then the number onto which
, then the number onto which ![]() maps
maps ![]() is denoted by
is denoted by ![]() . We read
. We read ![]() as “
as “![]() at
at ![]() .”
.”
A function maps each element of its domain onto only one element of its range. Graphically, this means that there is only one value of ![]() that can correspond to any value of
that can correspond to any value of ![]() .
.
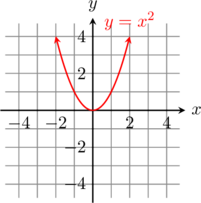
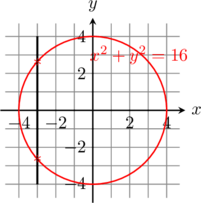
Vertical line test for a function: Any vertical line intersects the graph of a function in at most one point.
For example, a parabola would pass the vertical line test; hence it is a function.

But, a circle does not pass the vertical line test; hence, it is not a function.

This is based off of the misterioso color theme in Emacs. It’s predominantly blue/cyan faces on a dark cyan background.
Here are my color theme settings in Matlab.
Tags: Matlab, perferences
Introduction
The factorial of n, ![]() , is given by
, is given by
![Rendered by QuickLaTeX.com \[n! = \begin{cases} n \times (n-1) \times (n-2) \times \cdots \times 2 \times 1, & \text{if } n = 1, 2, 3, \ldots; \\ 1, & \text{if } n = 0. \end{cases}\]](https://kohar.ca/wp-content/ql-cache/quicklatex.com-56db6b74c562291026d56733bd653561_l3.png)
In Fortran, there is no intrinsic function for factorial, so we must write our own.
Tags: Fortran
These notes were developed as I was learning how to program in Fortran 90. Matlab is a great scripting language; however, when you need to do a lot of numerical computations, nothing beats Fortran (or C).
This is a great introduction in understanding Markov chains with the running example of calculating how many hops a knight can make around a chess before it returns to its starting position. Check it out.
I was reading Prediction, Learning, and Games by Cesa-Bianchi and Lugosi (2006), when I came across the following quote in their preface:
. . beware of mathematicians, and all those who make empty prophecies.
St. Augustine, De Genesi ad Litteram libri duodecim.
This was a bit bizarre, because I had read St. Augustine’s De doctrina christiana where he uses logic. Now, logic didn’t become part of mathematics (mathematical logic) until around the 19th century when De Morgan and Boole started to publish their work. (Leibniz had been working on logic in the 17th century, but it was not widely circulated.) But still, St. Augustine had been using mathematical ideas, and then yet warned Christians against the evils of mathematics?
These are my notes from the YouTube video below about using Org-mode in Emacs.
Tags: emacs, org-mode, phd writing, thesis, writing
I have been writing a couple of presentations in Beamer. Because I am so used to working in LaTeX now, it’s very frustrating to have to switch back to a Microsoft product such as Microsoft Powerpoint.
Slowly, I’m learning tricks to make my Beamer presentations more dynamic by revealing or hiding bullets or parts of a figure.
I wish I had found this post, How To Make a Presentation with Beamer, sooner. It would have saved me a lot of time!
The most useful tip for me was the \onslide command.
\onslide<4->{ content } This will reveal the content from slide 4 onwards.
\onslide<2-4>{ content } This will reveal the content only on slides 2 to 4.

Recent Comments